CBSE CLASS 9TH SCIENCE(PHYSICS) CHAPTER MOTION (Graphical ) Part-2
CBSE CLASS 9TH SCIENCE(PHYSICS) CHAPTER MOTION (Graphical ) Part-2
GRAPH:
A graph is a line, straight or curved which shows the variation of one quantity w.r.t other, which are interrelated with each other.
y=f(x)
In a relation of two quantities, the quantity which is made to alter at will, is called the independent variable.
The other quantity which varies as a result of this change is called the dependent variable.
 |
Graph |
In any graph , the independent variable is represented along x-axis (Time).
Dependent variable is represented along y-axis (Distance, Displacement, Speed , Velocity, Acceleration etc).
TYPES OF GRAPHS:
1. When object is at Rest
2. When Object is in Uniform Motion
3. When Object is in Non Uniform Motion (Increasingly and decreasingly )
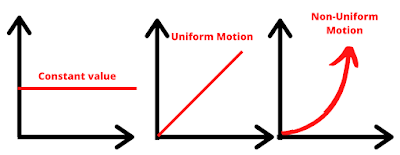 |
| Types of Graphs in Motion |
Distance-Time Graphs:
Distance time graph denoted by s-t graph shows the variation of distance covered by object taken on dependent axis with time independent axis.
Slope of the distance-time graph represents speed.
Slope of the distance-time graph represents speed.
1).Distance time graph for a stationary object:
The distance time graph for a object at rest is straight line parallel to time axis.
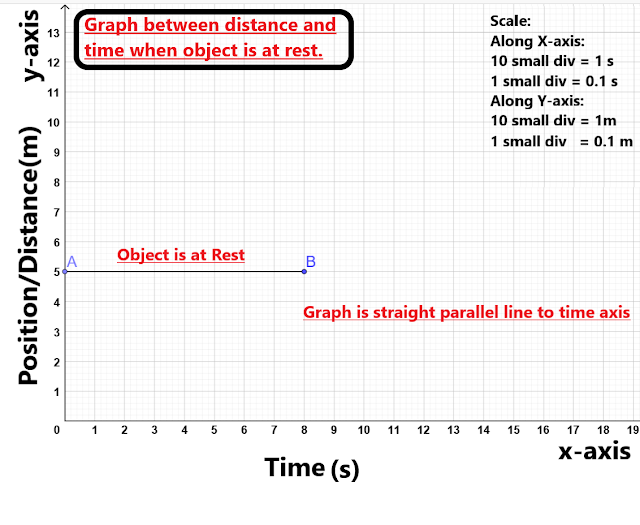 |
| Distance Time Graph When Object is at rest |
2. Distance Time graph for Linear Uniform Motion:
For uniform motion along a straight line , the distance time graph is straight line inclined at angle with time axis.
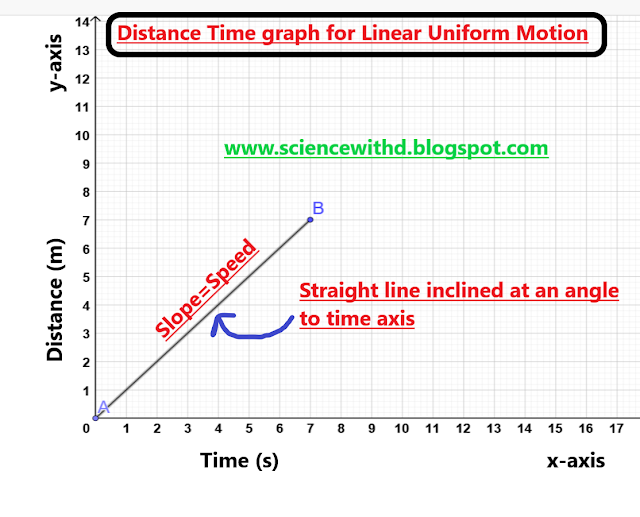 |
| Graph between Distance Time for Linear Uniform Motion |
4. Distance Time graph which are not possible:
 |
| Distance Time Graph which are not possible |
DISPLACEMENT TIME GRAPHS:
Displacement time graph denoted by s-t graph shows the variation of displacement covered by object taken on dependent axis with time independent axis.
Slope of the displacement-time graph represents velocity.
 |
| Displacement Time Graph |
VELOCITY-TIME GRAPHS:
ACCELERATION-TIME GRAPHS:SLOPE OF DISTANCE TIME GRAPH:
 |
| Slope of Distance time graph |
Slope = Uniform speed = Distance travelled / time taken = Δx/Δt= x2 – x1 /t2 – t1 = (6-4)/ (6-4)= 1 m/s.
SLOPE OF VELOCITY TIME GRAPH:
Slope = Uniform acceleration = velocity travelled / time taken = Δv/Δt= v2 – v1 /t2 – t1 = (6-4)/ (6-4)= 1 m/s2.
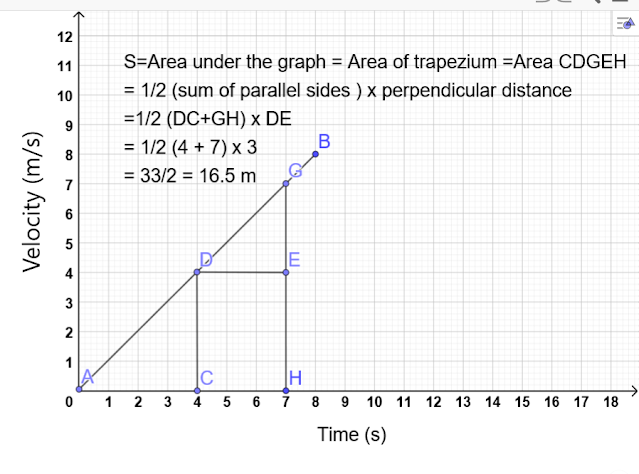
AREA UNDER VELOCITY - TIME GRAPH:
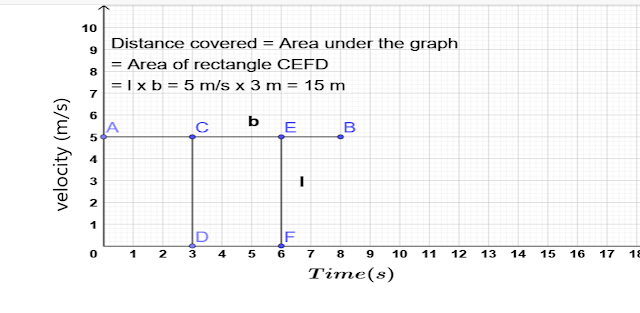
1)AREA UNDER CONSTANT VELOCITY - TIME GRAPH:
DISTANCE COVERED BY OBJECT IS GIVEN BY AREA UNDER THE GRAPH AS SHOWN BELOW:
2) AREA UNDER LINEAR VELOCITY- TIME GRAPH :
DISTANCE COVERED BY OBJECT IS GIVEN BY AREA UNDER THE GRAPH AS SHOWN BELOW:
For uniformly accelerated linear motion of an object velocity ,acceleration and the distance covered in a given time interval are correlated by set of three equations known as equations of motion.
1. VELOCITY - TIME EQUATION : v = u + at
2. POSITION - TIME EQUATION : S = ut + 1/2at2.
3. POSITION - VELOCITY EQUATION : v2 - u2 = 2aS
1. DERIVATION OF VELOCITY - TIME EQUATION : v = u + at
Consider the velocity - time graph of an object that moves under uniform acceleration shown as
a = (BC-DC)/OC = (v-u)/t
a =(v-u)/t
at=(v-u)
v = u + at
2. POSITION - TIME EQUATION : S = ut + 1/2at2.
Consider the velocity - time graph of an object that moves under uniform acceleration shown as
Distance covered by object = S = Area under graph
S = Area of trapezium OABDC
S = 1/2 (sum of parallel side ) x perpendicular distance between parallel sides
S = 1/2 ( OA + BC ) x AD = 1/2 ( OA + BC ) x OC
S = 1/2 ( u + v ) x t ( using v = u + at )
S = 1/2 ( u + u + at ) x t = 1/2 ( 2u + at ) x t
S = ( u + 1/2 at ) t = ut + 1/2at2
3. POSITION - VELOCITY EQUATION : v2 - u2 = 2aS
Distance covered by object = S = Area under graph
S = Area of trapezium OABDC
S = 1/2 (sum of parallel side ) x perpendicular distance between parallel sides
S = 1/2 ( OA + BC ) x AD = 1/2 ( OA + BC ) x OC
S = 1/2 ( u + v ) x t (using t = ( v - u )/a )
S = 1/2 ( u + v ) ( v - u )/a
2aS = (v + u ) ( v - u )
2aS = v2 - u2
v2 - u2 = 2aS




FREE FIRE
ReplyDeleteJsvdialdo
ReplyDelete